
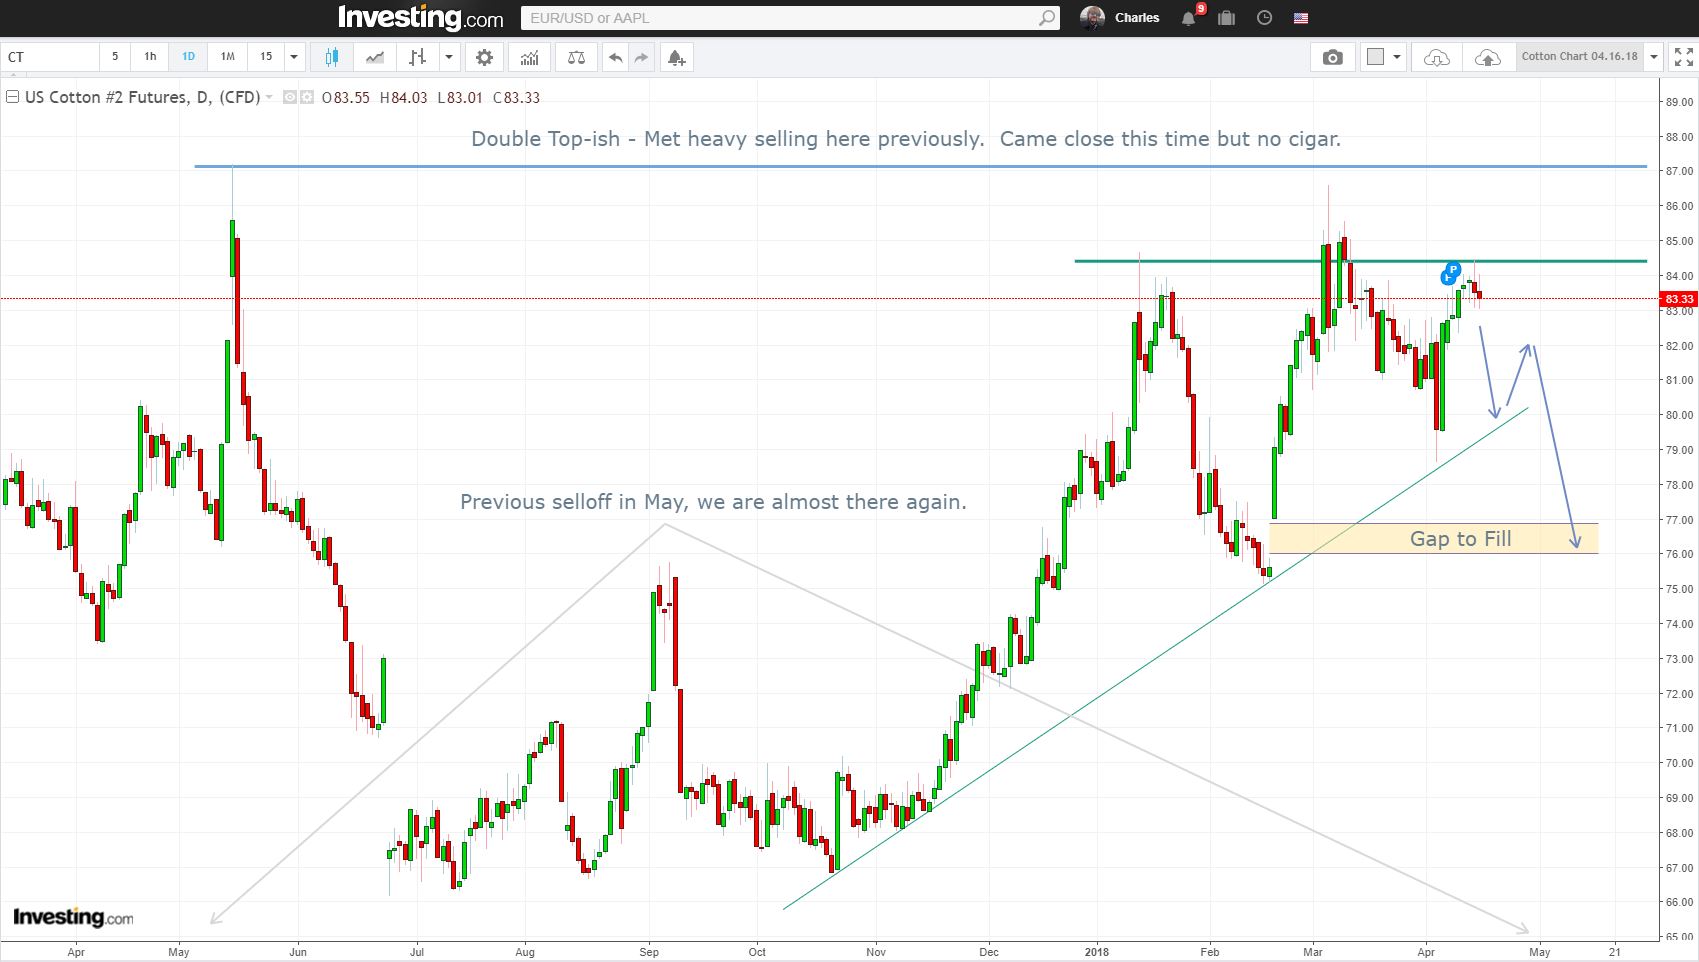
This is a very exciting trade, tomorrow could be a great entry point to short Cotton.
The daily chart shows a possible head and shoulders, with a potential gap to fill at 76.
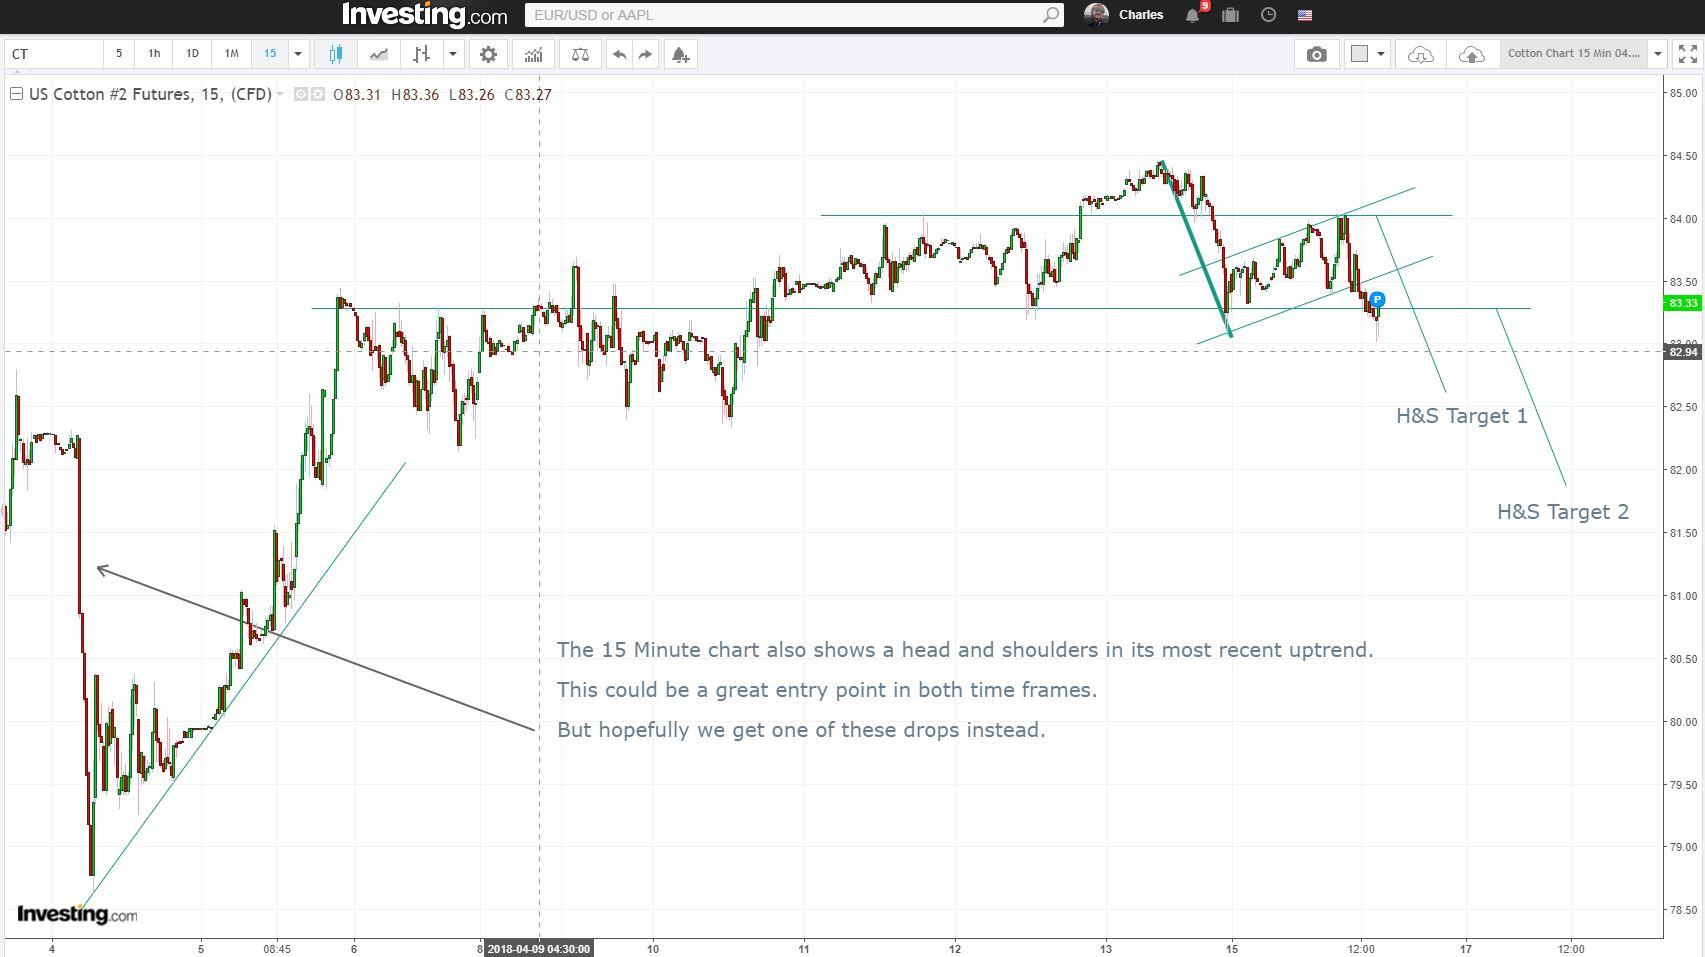
As does the minute chart. Being that the market looks decently positioned in both time frames for a near-term short.
This monthly chart showcases a tendency for Cotton to sell off at some point in April or May, somewhat consistently.

Here you can see the seasonal chart also shows a tendency in Cotton to decline past May.

Always trade at your own risk. This is not a recommendation to buy or sell any stock or commodity, it is merely commentary on a market.
Recent Comments